
Key Points:
- FSMI shed 0.9% month-to-date
- Top 5 funds were Indonesia and Asia ex-Japan funds
- Bottom 5 funds were mostly Global funds with high allocation in US and Europe
During the month of July, the MSCI AC World Index shed 3.4% (in RM terms) as the markets focused on two key issues in the US: whether the Republican and Democratic parties can agree on increasing the US debt ceiling before a 2 August deadline, and whether the credit agencies will downgrade the US credit rating. Elsewhere in Europe, Spain took centre stage as Moody's Investor Service placed the country's Aa2 rating on review for a possible downgrade while the country's prime minister announced an early general election, both of which were perceived as increased risks.
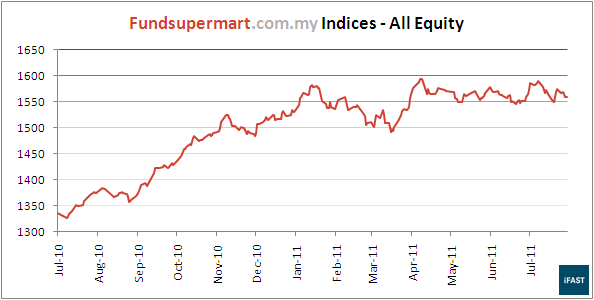
The top gainers during the month include Thailand, Indonesia and Japan, as the Stock Exchange of Thailand, Jakarta Composite, and Nikkei 225 gained 10.3%, 5.3 % and 2.8% respectively (in RM terms). During the month, the FSMI - All Equity index shed a marginal 0.9%, bringing the year-to-date returns to 1.8%.
Date FSMI- All Equity Returns Returns
(month-to-date) (year-to-date)
31-Jan-11 1,529.5 0.3% 0.3%
25-Feb-11 1,509.9 -1.7% -1.3%
31-Mar-11 1,567.0 3.6% 2.2%
27-Apr-11 1,559.8 0.4% 2.6%
31-May-11 1,577.0 0.4% 3.1%
30-Jun-11 1,572.5 -0.3% 2.8%
29-Jul-11 1,557.7 -0.9% 1.8%
Source: iFAST Compilations, as at 29 July 2011. Performance figures in the table are in RM terms,
calculated using NAV prices, with any income or dividend reinvested.
Indonesia, and AxJ too?
During the month, the MSCI Asia ex-Japan index slid 0.9% (in RM terms) while surprisingly, the top Asia ex-Japan funds (Table 2 below) returned at least 5.3%, pointing to the savvy stock picking skills of the fund manager.
In Indonesia, consumer confidence rose marginally from 105.3 points in May to 109.0 points in June due to better confidence on family income and employment expectations, suggesting that consumer spending is likely to improve in the coming months. Foreign funds continued to flow in during July, recording a net inflow of USD608 million for the month and bringing year-to-date figures to a net inflow of USD2,687 million (calendar year 2010: USD2,352 million net inflow).
On the currency exchange front, the RM strengthened against most major currencies, including the euro and US dollar by 3.3% and 1.8% respectively, while at the same time weakening against the yen and baht by 1.9% and 1.3% respectively. Since the start of 2011, the RM had risen against the US dollar and baht by 3.3% and 2.7% respectively and weakened against the euro and Aussie dollar by 3.9%, and 3.1% respectively (as of 29 July 2011).
Table 2: Top Five Equity Funds in July 2011
Return (%)
Top 5 Equity Funds Market/Sector (mth-to-date)(yr-to-date)
OSK -UOB Asian Asia excluding Japan; 6.1 1.8
Growth Opportunities Small to Medium Companies
Fund
OSK-UOB Indonesia Indonesia 6.0 9.3*
Equity Growth Fund
OSK-UOB Asia Asia excluding Japan; 5.3 8.6
Consumer Fund Consumer
OSK-UOB Asean ASEAN 4.8 9.7
Fund
Prudential Indonesia Indonesia 4.6 5.5**
Equity Fund
* Since inception on 4th April 2011
** Since inception on 27th April 2011
US and Europe Beset by Debt Problems
The worst performers during the month include US and Europe as the STOXX Europe 600 and S&P 500 shed 5.3% and 3.8% respectively (in RM terms).
On the economic front, the rate of growth of the manufacturing and services sectors in Eurozone continue to decelerate as services and manufacturing PMIs (Purchasing Managers Index) extended their downward trend for the third month. The weakness showed by the PMIs (although still suggesting growth albeit at a slower rate) has adversely affected business confidence levels as well.
In the US, economic data was mixed. Nonfarm payrolls rose by 18,000 in June, a far cry from the 105,000 expected by economists. A breakdown of the figure by industry indicates that severe job cuts were not a feature of any single segment, with government workers contributing the bulk of the job cuts for June. This supports the view that the US economy is not in a state of deterioration, where we would expect companies (rather than the government) to slash workers more vigorously.
Return (%)
Bottom 5 Equity Funds Market / Sector (mth-to-date)(yr-to-date)
Prundential Country
Selection Fund Global -6.8 -2.0
TA European Equity
Fund Europe including UK -4.9 0.7
RHB Global Themes
Fund Global -4.2 3.4
RHB Global Fortune
Fund Global -4.1 0.8
OSK-UOB Equity
Yield Fund Global -4.0 -0.8
Source: iFAST Compilations, as at 29 July 2011. Performance figures in the table are in RM terms, calculated using NAV prices, with any income or dividend reinvested.
Table 3: Bottom Five Equity Funds in July 2011
Return (%)
Bottom 5 Equity Funds Market / Sector (mth-to-date)(yr-to-date)
Prundential Country
Selection Fund Global -6.8 -2.0
TA European Equity
Fund Europe including UK -4.9 0.7
RHB Global Themes
Fund Global -4.2 3.4
RHB Global Fortune
Fund Global -4.1 0.8
OSK-UOB Equity
Yield Fund Global -4.0 -0.8
Source: iFAST Compilations, as at 29 July 2011. Performance figures in the table are in RM terms, calculated using NAV prices, with any income or dividend reinvested.
No comments:
Post a Comment